lab — experiment 01
The city, grown from its own records
Every point is a real Edmonton property from the public assessment roll — no map, no tiles, no drawing. The city assembles itself in build-year order: the river valley appears as an absence, the old core densifies, the ring suburbs bloom decade by decade. Switch to value view and the city lifts into a relief of what the market thinks of what time built.
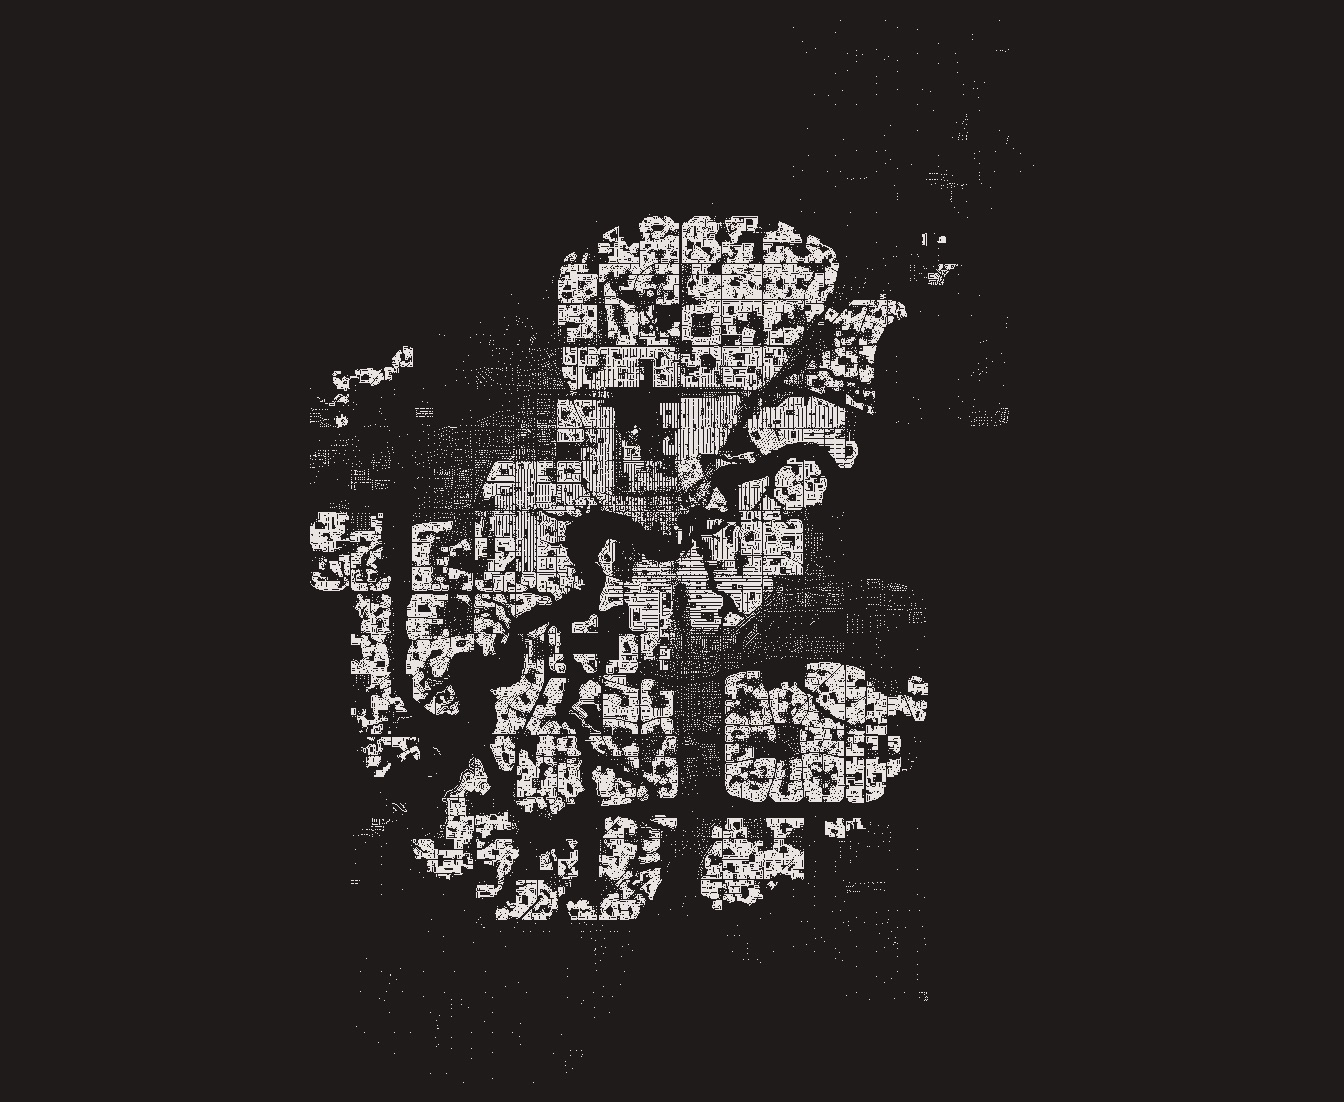
Animated map of Edmonton drawn from 412,955 property records, appearing in build-year order from 1880 to 2026. Currently showing 412,955 properties up to year 2026.
Source: City of Edmonton open data, dataset qi6a-xuwt, assessment year 2025, fetched 2026-08-11. 412,955 properties with usable coordinates and build years; 18,751 records without a usable build year are not shown. Coordinates quantized to ~11 m. Rendered on the GPU as a single point cloud — one vertex per record, a century as one number. New construction germinates green, then settles into ink. In value view one gold hue deepens with relative assessed value — steps at the 40th, 65th, 85th and 95th percentiles of the whole roll — and each point lifts by its percentile rank. Data emphasis, not favourability.